



Component Power BI
The Power BI block was designed to embed interactive reports and dashboards into the page with control over authentication, internal navigation, filters, bookmarks, landing page behavior, and iframe behavior across desktop and mobile. It is a solution built for scenarios where data needs to reach the frontend with visual context and flexible configuration.
General information
The Power BI block lets you embed reports from the Microsoft Power BI ecosystem directly into Studio CMS, preserving the report's own query, navigation, and presentation logic. It is especially useful for executive dashboards, operational dashboards, commercial reporting, analytical visualization, and contexts where data updates already live at the Power BI source.
This block can include:
- Full URL and Full URL (mobile) to control separate embeds by device
- Report ID, Group ID, and Client ID to identify the report, workspace, and tenant
- Auto Auth to automate user authentication when supported by the project
- Nav Content Panel Enabled and Filter Pane Enabled to show or hide report navigation and filters
- Page Name, Report Section, Bookmark, and Filter to define the landing page and initial embed state
- Page View, Fullscreen, Autoplay, Chromeless, and Action Bar Enabled to adjust viewing mode and user experience
- Config for additional technical embed settings
- control of Iframe Height and Iframe Width in separate desktop and mobile versions
Use this component when the page needs to display live data, detailed reports, or interactive dashboards without rebuilding the visualization in the frontend. Its strength is the direct connection to the report, but that also requires extra attention to performance, legibility, authentication, and responsiveness across screen sizes.
Visual examples of the block
3 typical analytical embed scenarios
The Power BI block can be used in different ways depending on the level of analytical depth required, how much navigation should remain visible, and how the experience adapts between desktop and mobile. The three examples below are visual simulations that represent common frontend scenarios while staying within the component's intended logic.
When to use / When to avoid
Correct use of the component
When to use
- For dashboards and reports that already live in Power BI and need to be presented directly in the frontend
- When the value lies in interactivity, filters, multiple report pages, or continuous data updates
- For executive dashboards, commercial reporting, operational metrics, or analytical contexts with a strong visual layer
- When authentication, permissions, and embed behavior have already been technically aligned
When to avoid
- When the page only needs static numbers or a very concise summary, with no analytical navigation
- When the report is too complex for the available space and becomes unreadable on smaller devices
- When authentication, tenant setup, or access permissions are still not clearly defined
How to configure it in practice
Recommended working sequence
Define the source
- Confirm which Full URL should be used as the main source and whether there is a dedicated Full URL (mobile)
- Correctly identify Report ID, Group ID, and, where applicable, Client ID
Prepare the experience
- Decide whether navigation and the filter pane should remain visible through Nav Content Panel Enabled and Filter Pane Enabled
- Choose the landing page with Page Name and fine-tune the initial state with Report Section or Bookmark
Adjust behavior
- Configure Page View, Fullscreen, Autoplay, Chromeless, and Action Bar Enabled according to the context
- Use Filter and Config only when there is a concrete and validated need
Validate per device
- Adjust Iframe Height and Iframe Width independently for desktop and mobile
- Test legibility, internal scrolling, and report behavior on smaller screens
Configuration best practices
Legibility, navigation, and technical control
Visual experience
- Not every report works well in a narrow embed; choose versions designed for the real space where the block will live
- If the analysis depends on many filters and details, consider giving the iframe more height or preparing a cleaner landing page
- On mobile, a dedicated URL usually improves legibility significantly
Technical control
- Auto Auth, Client ID, and the report source itself should be validated with the technical team before publication
- Fields such as Filter, Bookmark, and Config become valuable when there is a clear use case, not just excessive parametrization
- If the report already includes too much native navigation, hiding secondary elements can help the page breathe better
Advanced settings for the Power BI component
Block structure and iframe dimensions
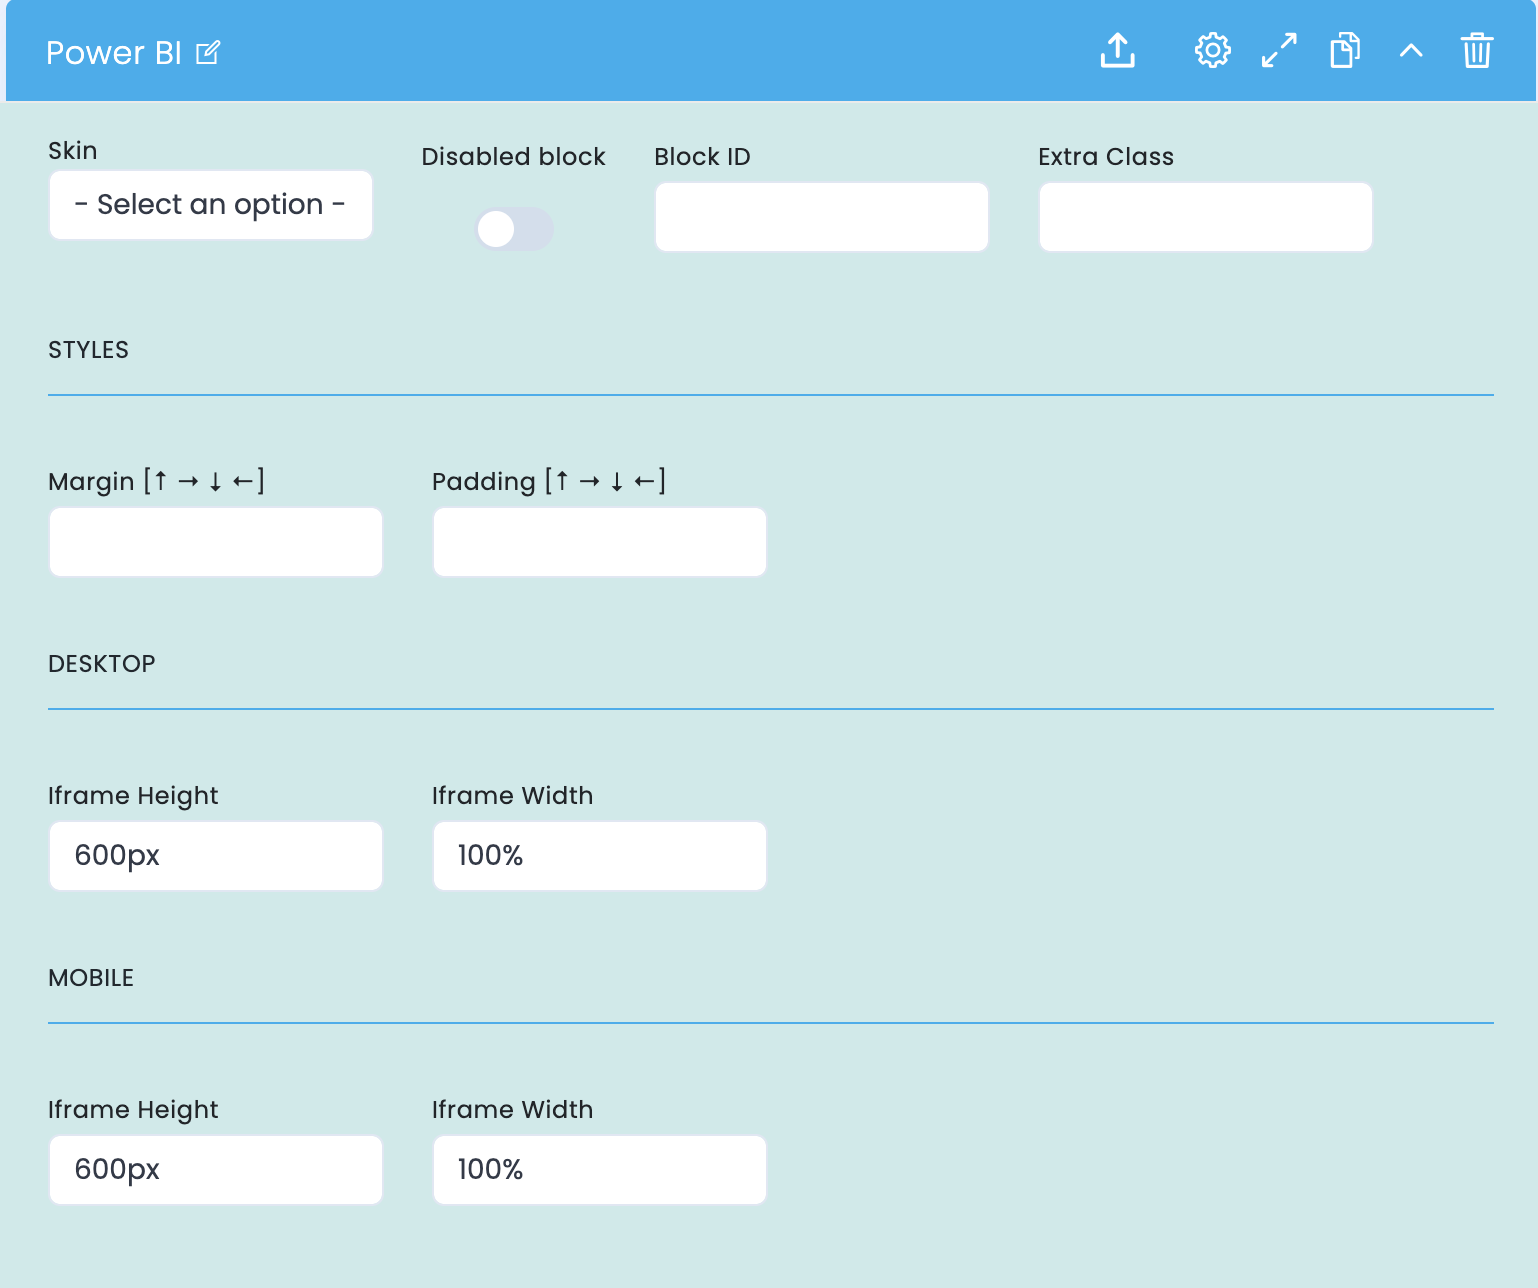
These options control the block's base structure and how the embed occupies space in the layout, with independent dimensions for desktop and mobile.
Base structure
- Skin defines the component's overall visual variant
- Disabled block lets you disable the block without removing it
- Block ID and Extra Class are useful for anchors, internal navigation, and specific customizations
Spacing
- Margin controls the outer space around the block
- Padding controls the inner space around the embed
- These fields help fit denser reports into the page rhythm without creating visual noise
Desktop and mobile
- Iframe Height and Iframe Width are available in separate desktop and mobile sections
- This allows better control over report legibility depending on the device
- This is often where excessive scrolling, unwanted cropping, or an embed area that is too short gets avoided
Main content configuration
URL, authentication, navigation, and report behavior
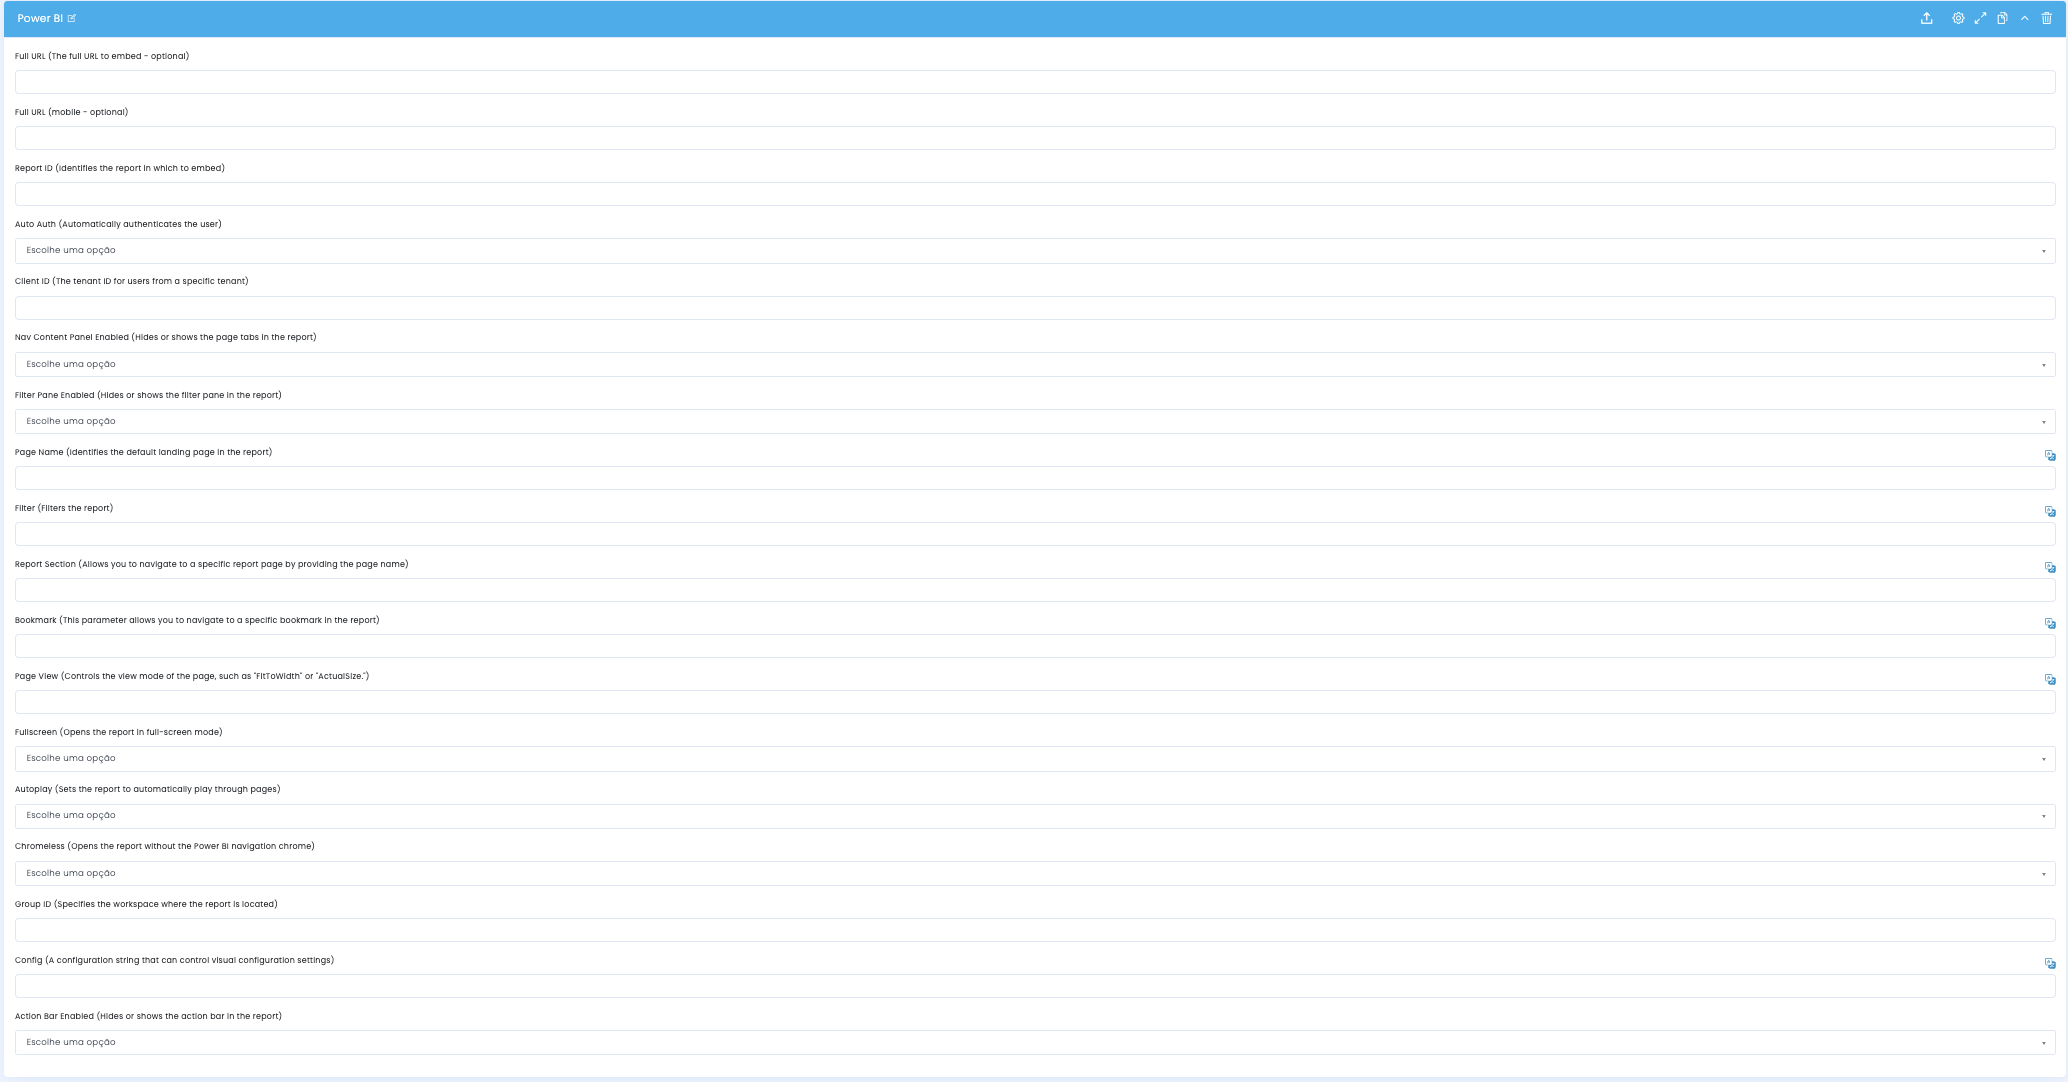
In the main configuration you define the report source, authentication method, visible panels, startup filters, and the overall embed behavior.
Source and authentication
- Full URL and Full URL (mobile) define the embed per device
- Report ID, Group ID, and Client ID identify the report source and technical context
- Auto Auth can simplify access when there is integration with user authentication
Navigation and initial state
- Nav Content Panel Enabled and Filter Pane Enabled control the visibility of Power BI's own panels
- Page Name, Report Section, and Bookmark help open the report in a more editorially useful state
- Filter can apply startup rules to show only the relevant slice of the data
Presentation mode
- Page View controls the report's visual scale, with options such as FitToWidth or ActualSize
- Fullscreen, Autoplay, Chromeless, and Action Bar Enabled define the type of interaction available
- Config is used for additional technical fine-tuning when the project requires more specific behavior
Related guides
Complementary context for this block